Search results
Search for "amplitude calibration" in Full Text gives 9 result(s) in Beilstein Journal of Nanotechnology.
Determining amplitude and tilt of a lateral force microscopy sensor
Beilstein J. Nanotechnol. 2021, 12, 517–524, doi:10.3762/bjnano.12.42

- frequency-modulation atomic force microscopy, the tip oscillates parallel to the surface. Existing amplitude calibration methods are not applicable for mechanically excited LFM sensors at low temperature. Moreover, a slight angular offset of the oscillation direction (tilt) has a significant influence on
- for a given amplitude and tilt. Finally, the amplitude and tilt are determined by fitting the simulation output to the data with oscillation. Keywords: frequency-modulation atomic force microscopy; lateral force microscopy; amplitude calibration; tilt estimation; Introduction Frequency-modulation
- both with oscillation and without as the CO bends faster than the cantilever moves. At the heights where we performed the amplitude calibration, we did not observe a LFM signal, meaning that the lateral forces were insignificant. Also, the excitation frequency of the frustrated translational mode is in


Electrostatically actuated encased cantilevers
Beilstein J. Nanotechnol. 2018, 9, 1381–1389, doi:10.3762/bjnano.9.130

- , or vacuum environments. Keywords: amplitude calibration; atomic force microscopy; electrostatic excitation; encased cantilevers; liquid AFM; Introduction Dynamic atomic force microscopy requires excitation of the cantilever oscillation. Most commonly, this is achieved using a dither piezo built


Material discrimination and mixture ratio estimation in nanocomposites via harmonic atomic force microscopy
Beilstein J. Nanotechnol. 2017, 8, 2771–2780, doi:10.3762/bjnano.8.276

- thermal calibration method [39]. For amplitude calibration the inverse optical lever sensitivity in units of nm/V was determined via a noncontact method proposed by M. J. Higgins et al. [36]. The noise level of the AFM optical detector was less than 60 μV, which corresponds to an amplitude noise of


Functional dependence of resonant harmonics on nanomechanical parameters in dynamic mode atomic force microscopy
Beilstein J. Nanotechnol. 2017, 8, 883–891, doi:10.3762/bjnano.8.90

- ambient conditions. The time evolution is expressed in terms of sequentially acquired images. The free oscillation amplitude was set to 30 nm and setpoint to Asp = 27 nm, respectively. The missing points 3, 4 and 5 correspond to approach curves taken for amplitude calibration. The continuous blue lines


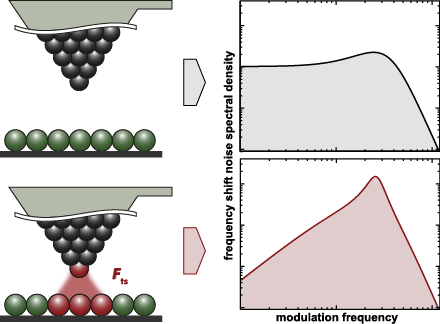
Noise in NC-AFM measurements with significant tip–sample interaction
Beilstein J. Nanotechnol. 2016, 7, 1885–1904, doi:10.3762/bjnano.7.181
- convert voltage signals delivered by the instruments to physical units. The detection sensitivity for the herein presented data is determined to 52.5 nm/V from an amplitude calibration (see [19] and Supporting Information of [11]). A PLLpro2 control system (RHK Technology, Inc., Troy, MI, USA) is used
- excitation calibration factors and , respectively, where is determined by an amplitude calibration as described in [19] while is determined from measuring the oscillation amplitude in resonance for a given excitation voltage Vexc. Assuming Q0 = A/Aexc = allows a straightforward calculation of from known
- parameters of a well-characterised system. Note that by rewriting this formula to , we can fully describe Hac without performing an amplitude calibration measurement. The characteristics of the loop are defined by two parameters, the gain PA and the integral cutoff IA. Assuming that the cantilever is a


![[Graphic 32]](/bjnano/content/inline/2190-4286-7-181-i73.png?max-width=637&scale=1.18182) wit...
wit...

![[Graphic 34]](/bjnano/content/inline/2190-4286-7-181-i75.png?max-width=637&scale=1.18182) wit...
wit...


Understanding interferometry for micro-cantilever displacement detection
Beilstein J. Nanotechnol. 2016, 7, 841–851, doi:10.3762/bjnano.7.76

- oscillation amplitude of λ/8. The measured maximum voltage in combination with the wavelength is used for amplitude calibration by applying an arcsine function to account for the approximately sinusoidal modulation of the interferometric fringes as a function of d. For a cavity with low , this is a good


![[Graphic 27]](/bjnano/content/inline/2190-4286-7-76-i36.png?max-width=637&scale=1.18182) of the noise floor of the interferometer signal as a function of the...
of the noise floor of the interferometer signal as a function of the...
Thermal noise limit for ultra-high vacuum noncontact atomic force microscopy
Beilstein J. Nanotechnol. 2013, 4, 32–44, doi:10.3762/bjnano.4.4

- different amplitude calibration factors for the corresponding modes. However, due to the length of only 40 μm and 35 μm, for the high-frequency cantilevers AP 5 and AL 3, the laser adjustment becomes difficult, yielding only 77 μW and 18 μW laser power on the PSD compared to about 100 μW for other
- output of the demodulator and demonstrated that predictions based on the demodulator transfer function and filtering are well reproduced by experiments. For a quantitative analysis of the noise, a precise amplitude calibration of the detection system relating electrical signals to the mechanical


![[Graphic 53]](/bjnano/content/inline/2190-4286-4-4-i64.png?max-width=637&scale=1.18182) =
= ![[Graphic 32]](/bjnano/content/inline/2190-4286-4-4-i43.png?max-width=637&scale=1.18182) f...
f...


![[Graphic 56]](/bjnano/content/inline/2190-4286-4-4-i67.png?max-width=637&scale=1.18182) using three diff...
using three diff...

Calculation of the effect of tip geometry on noncontact atomic force microscopy using a qPlus sensor
Beilstein J. Nanotechnol. 2013, 4, 10–19, doi:10.3762/bjnano.4.2

- images and spectra can be generated to theoretically calculate the effect; however, one must carefully consider both the amplitude calibration and the methods for calculating frequency shifts from a potential before continuing. Effect on frequency shift Under the assumption that the direction of motion
- for tip motion parallel to the cantilever oscillation. However, if lateral forces are present, then these will also affect the frequency shift. Effect on calibration Amplitude calibration in qPlus AFM is usually performed by measuring the z extension needed to maintain a constant value for [10]. As


Characterization of the mechanical properties of qPlus sensors
Beilstein J. Nanotechnol. 2013, 4, 1–9, doi:10.3762/bjnano.4.1

- , namely the amplitude calibration (see Equation 8). The other two methods do not depend on the amplitude calibration. They depend only on size measurements, which can be calibrated with very high accuracy by using optical or electron microscopes. Therefore, we suppose that the overall error in the force


Other Beilstein-Institut Open Science Activities